

반응형
chatGPT가 파이썬 코드 리뷰도 해준다.
정말 똑똑한 녀석이군....^^;;;
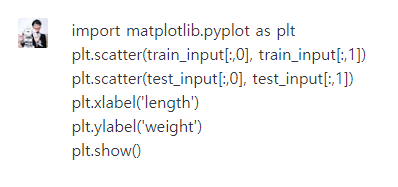
import matplotlib.pyplot as plt
plt.scatter(train_input[:,0], train_input[:,1])
plt.scatter(test_input[:,0], test_input[:,1])
plt.xlabel('length')
plt.ylabel('weight')
plt.show()

This is a Python code snippet that uses the Matplotlib library to create a scatter plot. Here's a brief explanation of what it does:
- The first line imports the Matplotlib library and assigns it the alias plt.
- The second line creates a scatter plot using the scatter function. The first argument, train_input[:,0], specifies the x-coordinates of the data points to plot, while the second argument, train_input[:,1], specifies the y-coordinates. This creates a scatter plot of the training data.
- The third line adds another set of data points to the plot using the scatter function again. This time, the x-coordinates and y-coordinates are specified using test_input[:,0] and test_input[:,1], respectively. This creates a scatter plot of the test data.
- The fourth and fifth lines add labels to the x-axis and y-axis, respectively, using the xlabel and ylabel functions.
- Finally, the show function is called to display the plot.
It appears that this code is plotting a dataset of length and weight measurements. The train_input and test_input variables likely contain the input data for a machine learning model, and this plot is being used to visualize the data.

반응형
'IT관련' 카테고리의 다른 글
| ChatGPT로 코드 오류 찾기/디버깅(LinAlgError) (0) | 2023.02.21 |
|---|---|
| 레노버노트북PC 한글 단축키 안먹힐 때 해결방법(핫키 비활성화) (0) | 2023.02.18 |
| OpenAI ChatGPT가 말하는 코딩교육의 필요성 (0) | 2023.02.01 |
| 유데미 The Web Developer 부트캠프 2023 - colt steele (0) | 2023.01.24 |
| 한국방송통신대학교 프라임칼리지 학사학위과정(AI 인공지능 전공 커리큘럼 소개) (0) | 2023.01.12 |