
import seaborn as sb

# 데이터로드
mpgData = sb.load_dataset('mpg')

mpgData = mpgData.dropna()

indVarNames = ['cylinders','displacement','horsepower','weight','acceleration','model_year']
x_total = mpgData[indVarNames]

depVarName = 'mpg'
y_total = mpgData[depVarName]

from sklearn.model_selection import train_test_split

x_total_np = x_total.to_numpy()
y_total_np = y_total.to_numpy()

x_train, x_test, y_train, y_test = train_test_split(x_total_np, y_total_np, test_size = 0.30, random_state=10)

# 모형학습

from sklearn import linear_model

reg = linear_model.LinearRegression()
reg.fit(x_train, y_train)

# 학습 결과 확인

print("상수항 : %.4f" % reg.intercept_)
print("계수: ", reg.coef_)

# 모형 성능 평가

y_predicted = reg.predict(x_test)

from sklearn.metrics import r2_score
print("결정계수 %.4f" % r2_score(y_test, y_predicted))

adj_r2_score = 1 - (1 - r2_score(y_test, y_predicted)) * (len(y_total)-1)/(len(y_total)-x_total.shape[1]-1)
print("수정된 결정계수 %.4f" % adj_r2_score)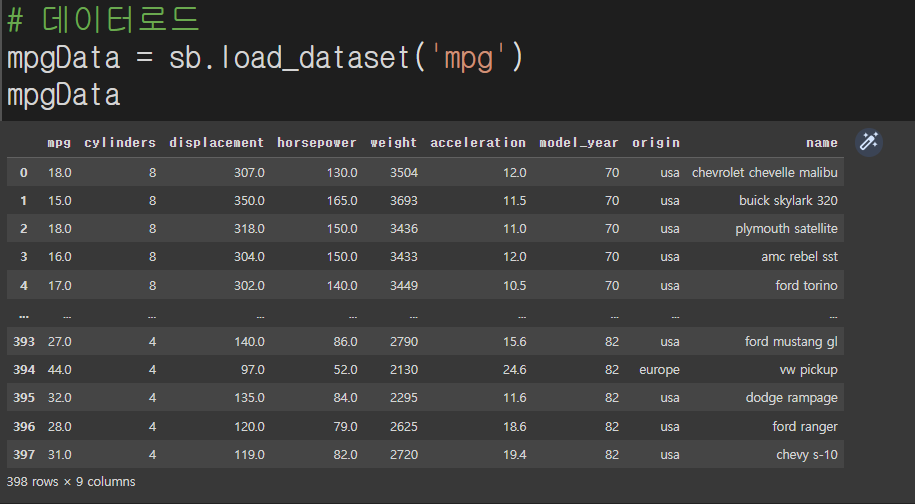
이 코드는 seaborn 라이브러리를 사용하여 "mpg" 데이터셋에서 scikit-learn 라이브러리를 이용하여 선형 회귀 모델을 만드는 예제입니다.
데이터셋은 seaborn 라이브러리를 사용하여 로드되며, 누락된 값은 삭제됩니다. 독립 변수는 열 이름의 리스트를 사용하여 지정하고 "x_total" 변수에 저장되며, 종속 변수 "mpg"는 "y_total" 변수에 저장됩니다.
다음으로, scikit-learn의 train_test_split 함수를 사용하여 데이터셋을 훈련 세트와 테스트 세트로 분할합니다. 테스트 세트의 크기는 전체 데이터의 30%로 설정되며, random_state 매개 변수는 재현성을 보장하기 위해 설정됩니다.
그 후, LinearRegression 클래스를 사용하여 훈련 데이터를 사용하여 선형 회귀 모델을 피팅합니다. 모델의 y절편과 계수가 출력됩니다.
마지막으로, 모델의 성능을 평가합니다. 예측된 값은 피팅된 모델의 predict 메소드를 사용하여 얻습니다. 그런 다음, scikit-learn의 r2_score 함수를 사용하여 R-squared 및 조정된 R-squared 점수를 계산합니다.
This code is an example of a linear regression model on the "mpg" dataset using scikit-learn library. The dataset is first loaded using seaborn library and then preprocessed to remove missing values. The independent variables are specified using a list of column names and stored in the "x_total" variable, while the dependent variable "mpg" is stored in the "y_total" variable.
Next, the dataset is split into training and testing sets using the train_test_split function from scikit-learn. The size of the testing set is set to 30% of the total data and the random_state parameter is set to ensure reproducibility.
After that, a linear regression model is fitted using the training data with the LinearRegression class from scikit-learn. The intercept and coefficients of the fitted model are then printed.
Finally, the performance of the model is evaluated using the R-squared and adjusted R-squared metrics. The predicted values are obtained using the predict method of the fitted model, and then the R-squared and adjusted R-squared scores are calculated using the r2_score function from scikit-learn.
'Data Science' 카테고리의 다른 글
| [AI와빅데이터경영입문] 트리분석 graphviz (0) | 2023.03.09 |
|---|---|
| [AI와빅데이터경영입문] kNN (0) | 2023.03.09 |
| [AI와빅데이터경영입문] 나이브베이즈 (0) | 2023.03.09 |
| [AI와빅데이터경영입문] 데이터시각화 (0) | 2023.03.09 |
| [AI와빅데이터경영입문] 데이터변환 (0) | 2023.03.09 |