반응형
from tensorflow.keras import datasets, models
from tensorflow.keras import Sequential, optimizers
from tensorflow.keras.layers \
import Flatten, Dense, Conv2D, MaxPooling2D
# MNIST 필기체 숫자 데이터세트 가져오기
(train_imgs, train_labels), (test_imgs, test_labels) \
= datasets.mnist.load_data()
# 픽셀 값을 0~1 사이로 정규화
train_imgs, test_imgs \
= train_imgs / 255.0, test_imgs / 255.0
# Conv2D에 맞게 데이터 reshape
train_imgs = train_imgs.reshape(60000, 28, 28, 1)
test_imgs = test_imgs.reshape(10000, 28, 28, 1)

# 모델 구성 후 요약 정보 출력
model = Sequential()
model.add(Conv2D(32, (3, 3), activation='relu',
input_shape=(28, 28, 1)))
model.add(MaxPooling2D((2, 2)))
model.add(Conv2D(64, (3, 3), activation='relu'))
model.add(MaxPooling2D((2, 2)))
model.add(Conv2D(64, (3, 3), activation='relu'))
model.add(Flatten())
model.add(Dense(64, activation='relu'))
model.add(Dense(10, activation='softmax'))
model.summary()
# 모델 컴파일
model.compile(optimizer=optimizers.SGD(0.01, momentum=0.9),
loss='sparse_categorical_crossentropy',
metrics=['accuracy'])
# 학습
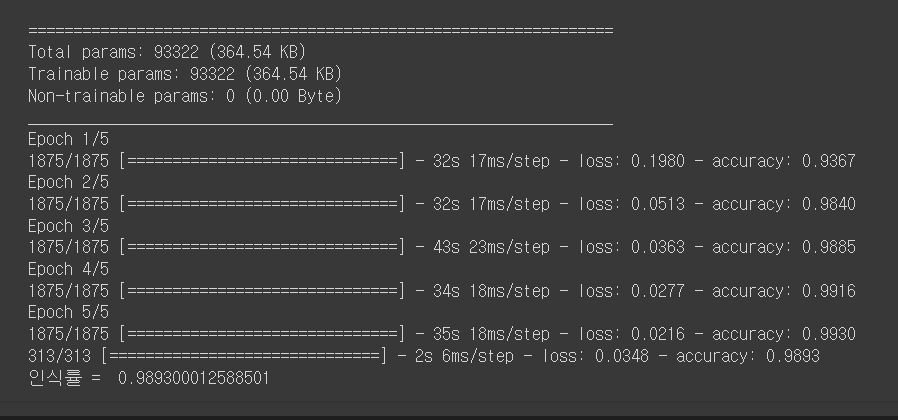
model.fit(train_imgs, train_labels, verbose=1, epochs=5)
# 모델 저장
models.save_model(model, 'CNN-mnist')
# 테스트 집합을 대상으로 평가
_, test_acc = model.evaluate(test_imgs, test_labels)
print('인식률 = ', test_acc)
import matplotlib.pyplot as plt
from tensorflow.keras import datasets
from tensorflow.keras import models
import numpy as np
# MNIST 테스트 데이터세트 로드
_, (test_imgs, test_labels) = datasets.mnist.load_data()
# 픽셀 값을 0~1 사이로 정규화
test_imgs = test_imgs / 255.0

# Conv2D에 맞게 데이터 reshape
test_imgs = test_imgs.reshape(10000, 28, 28, 1)
# 저장된 모델 로드
model = models.load_model('CNN-mnist')
model.summary()
# 테스트 집합에 대한 인식 결과 구하기
result = model.predict(test_imgs)
# 첫 25개의 이미지와 인식 결과 디스플레이
plt.figure(figsize=(6, 6), tight_layout=True)
for i in range(25):
    plt.subplot(5, 5,i+1)
    plt.xticks([])
    plt.yticks([])
    plt.grid(False)
    timg = test_imgs[i].reshape(28, 28)
    plt.imshow(timg, cmap=plt.cm.gray_r)
    plt.title('{}'.format(np.argmax(result[i])))
plt.show()
# 오인식 이미지 리스트를 구함
err_imgs, err_labels = [], []
for i in range(10000):
    lbl = np.argmax(result[i])
    if lbl != test_labels[i]:
        err_imgs.append(test_imgs[i])
        err_labels.append('{}-->{}'.format(test_labels[i], lbl))
print('인식률 = ', (10000 - len(err_labels)) / 10000)
# 첫 25개의 오인식 이미지 디스플레이
plt.figure(figsize=(6, 6), tight_layout=True)
for i in range(min(25, len(err_labels))):
    plt.subplot(5, 5,i+1)
    plt.xticks([])
    plt.yticks([])
    plt.grid(False)

    timg = err_imgs[i].reshape(28, 28)
    plt.imshow(timg, cmap=plt.cm.gray_r)
    plt.title(err_labels[i])
plt.show()반응형
'Data Science' 카테고리의 다른 글
| 오일석 파이썬으로 만드는 인공지능 부록 (0) | 2023.12.18 |
|---|---|
| 의사결정나무(DecisionTree) 파이썬 예제 코드 (1) | 2023.12.03 |
| 데이터 분석가가 반드시 알아야 할 모든 것(황세웅, 위키북스) (1) | 2023.11.27 |
| 머신러닝 딥러닝 캐글 문제해결 체크리스트 (0) | 2023.11.13 |
| 데이터 엔지니어(링)를 위한 97가지 조언 (0) | 2023.11.06 |


