반응형
seaborn 그래프_경향성_크기_분포_연관성 파악.ipynb
0.66MB

# 라이브러리와 데이터를 불러오고, 시각화를 위한 세팅을 합니다.
import seaborn as sns
sns.set_theme(style='whitegrid')
penguins = sns.load_dataset("penguins").dropna()
penguins

# penguin 데이터에 lineplot을 출력합니다. 질량에 따른 발길이
sns.lineplot(data=penguins, x="body_mass_g",
             y= "flipper_length_mm", ci = None)

# penguin 데이터에 lineplot을 출력합니다. 질량에 따른 발길이
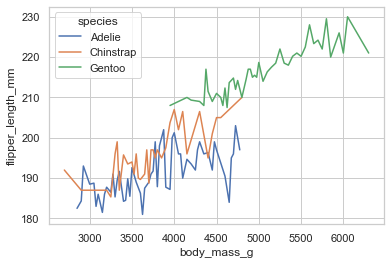
# 종별로 보고 싶을 때 옵션
sns.lineplot(data=penguins, x="body_mass_g",
             y= "flipper_length_mm",
             ci = None,
            hue='species')

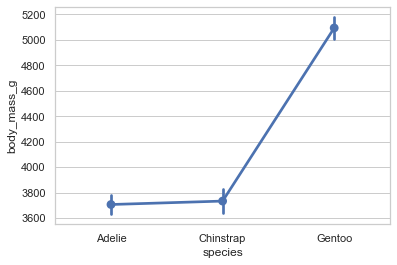
# penguin 데이터에 pointplot을 출력합니다.
# 종에 따른 무게

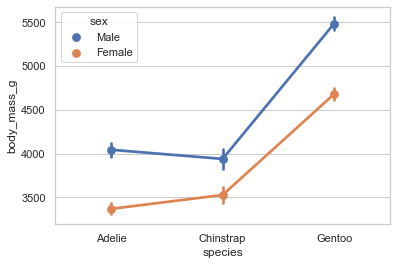
sns.pointplot(data=penguins,
             x='species',
             y='body_mass_g',
             hue='sex',
             palette='ocean')






반응형
'Data Science' 카테고리의 다른 글
| 웹 크롤링을 통한 데이터 수집 (0) | 2023.01.31 |
|---|---|
| [판다스] 여러 엑셀 파일 합치기 (0) | 2023.01.31 |
| 살아움직이는 그래프 plotly (0) | 2023.01.31 |
| 판다스 기초 피벗 테이블 (0) | 2023.01.31 |
| 여러 데이터 쉽게 불러오기 (0) | 2023.01.31 |
